- Published on
Indian Equity Index Exploration 2024
Introduction
At the beginning of every year, one of the questions that lingers in the minds of stock market investors is, 'How do I allocate my funds into different stock categories like large-cap, mid-cap, and small-cap?'
In this notebook, we will examine the historical performance of various Indian stock indices and their returns based on the Price-to-Book (P/B) and Price-to-Earnings (P/E) ratios. This analysis may provide us with some insights into the decision-making process for the question mentioned above.
Disclaimer: I am not a registered financial advisor or a certified expert in financial matters. The information and financial tidbits shared here are for general informational purposes only. Any financial decisions you make based on this information are your responsibility. Always consult with a qualified financial advisor, accountant, or legal professional before making any financial decisions or investments. I make no warranties or representations regarding the accuracy, reliability, or completeness of the information provided. I shall not be held liable for any losses or damages arising from the use of this information.
Analysis Overview
For this analysis, we will look into 5 major Indian indices.
- Nifty 50
- Nifty Next 50
- Nifty Midcap 150
- Nifty Smallcap 250
- Nifty Microcap 250
One can find more information about these indices on the NSE website. Simply put, "Nifty 50" represents the top 50 companies by market capitalization, "Nifty Next 50" represents companies ranked from 51 to 100 by market capitalization, "Nifty Midcap 150" represents companies ranked from 101 to 250, "Nifty Smallcap 250" represents companies ranked from 251 to 500, and "Nifty Microcap 250" represents companies ranked from 501 to 750.
We will consider two main valuation parameters: the Price-to-Book (P/B) ratio and the Price-to-Earnings (P/E) ratio. In simple terms, the P/B ratio is about comparing the stock price to the company's net assets, while the P/E ratio is about comparing the stock price to the company's earnings.
The P/B ratio is available for all the indices, while the P/E ratio is missing for multiple years for the last three indices. Therefore, we will consider the P/B ratio for all indices and the P/E ratio only for the first two.
Nifty 50 Analysis
- We will obtain the P/B ratio at the beginning of each year and the index returns for that year, then create a scatterplot.
- Additionally, we will include a regression line among these points.
- Furthermore, we will incorporate a vertical line to indicate the P/B value at the start of 2024.
- The horizontal line represents the potential expected return from the index for 2024. Please note that this estimation is solely based on the regression with the P/B ratio and may not be entirely accurate.
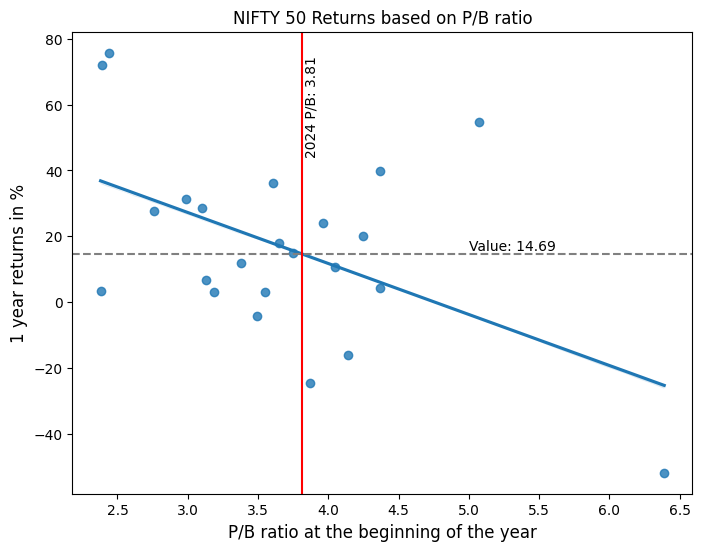
Observations:
- As the P/B ratio increases, one-year returns decrease, as indicated by the blue regression line.
- The potential expected return for 2024, based on the regression line, is 14.69%.
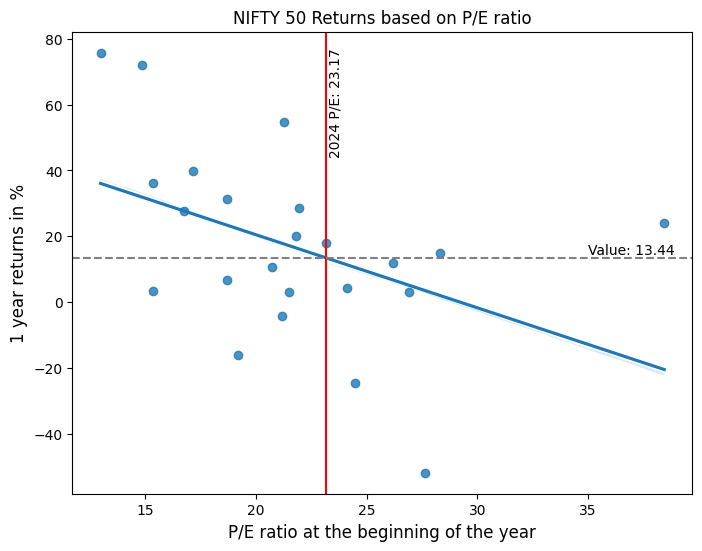
Observations:
- As the P/E ratio increases, one-year returns decrease, as indicated by the blue regression line.
- The potential expected return for 2024, based on the regression line, is 13.44%.
Nifty Next 50 Analysis
Now we will repeat the analysis for Nifty Next 50.
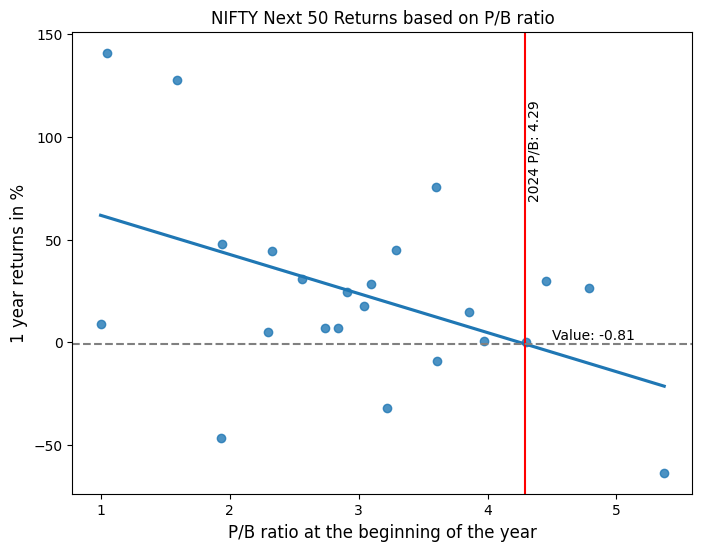
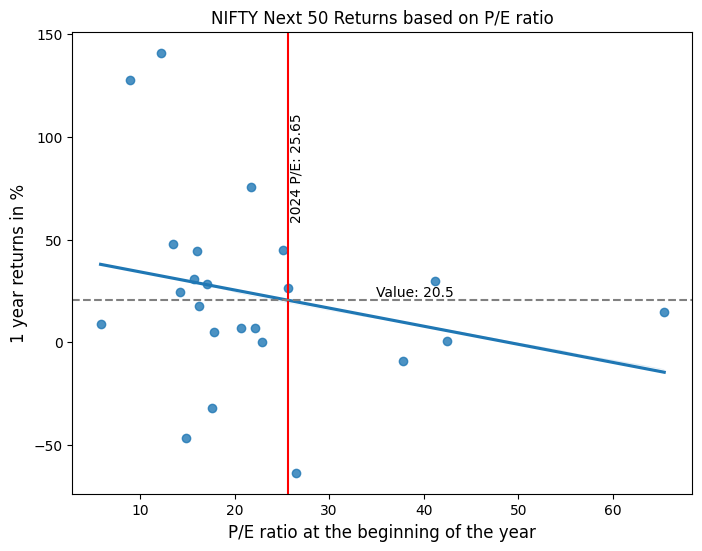
Observations:
- The potential expected return for 2024, based on the P/B regression line, is -0.81%.
- The potential expected return for 2024, based on the P/E regression line, is 20.5%.
Nifty Midcap 150 Analysis
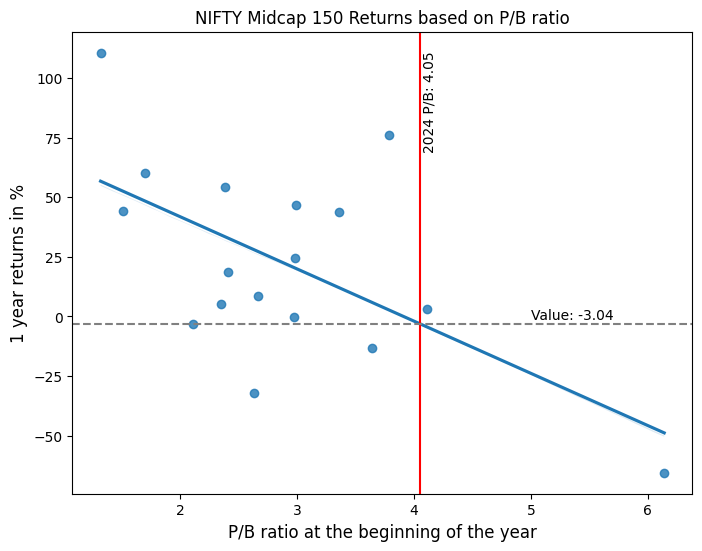
Observation:
- The potential expected return for 2024, based on the P/B regression line, is -3.04%.
Nifty Smallcap 250 Analysis
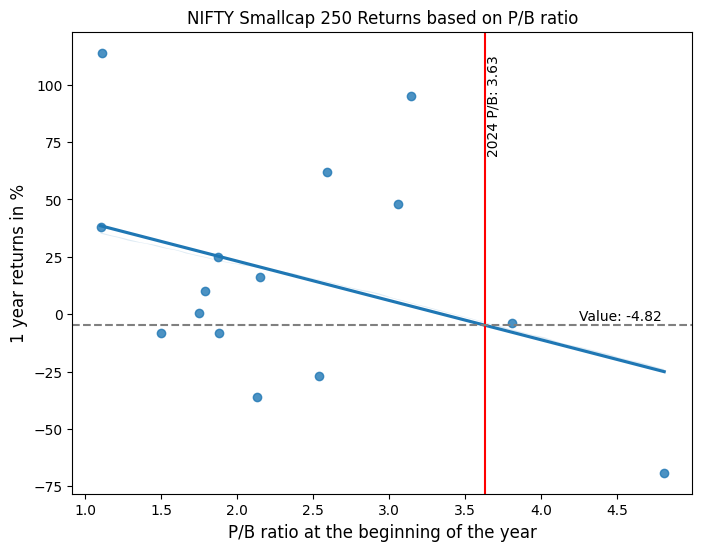
Observation:
- The potential expected return for 2024, based on the P/B regression line, is -4.82%.
Nifty Microcap 250 Analysis
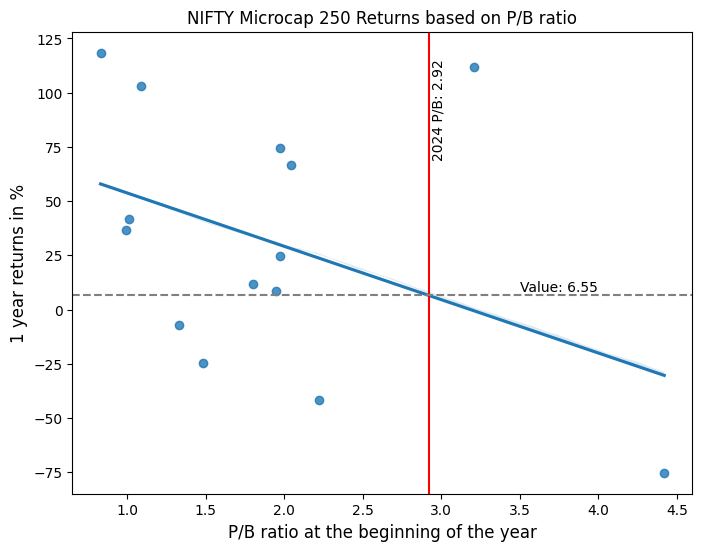
Observation:
- The potential expected return for 2024, based on the P/B regression line, is 6.55%.
Conclusion
It appears that the expected returns for most of the Indian indices are negative for this year. The Nifty 50 index appears to offer a better potential expected return than the other indices. Once again, please conduct your own due diligence before making any decisions!
Hope you found this analysis enjoyable, and please feel free to leave a comment about any other topics of interest to you in the Indian Capital Markets.